In April of 2010, Google announced that they include site speed as one of the signals in their search ranking algorithms. The reasoning behind that decision was rather simple “Faster sites create happy users”. Google, even did some research to back the obvious that users prefer faster websites. For a visitor of a website the speed is no doubt an important factor to the overall user experience, but according to the head of Google’s Webspam team, Matt Cutts, site speed plays only a minuscule role in Google search ranking algorithms and perishes in comparison to relevancy factors:
Google estimates that less than 1 out of 100 queries are impacted by the site speed factor. Nevertheless, a fast website is extremely important in a broader picture. Well optimized web pages preserve server resources, improve user experience and ensure that the website will not be penalized by Google’s page speed check.
How can you tell if the website is slow in Google’s eyes?
To help webmasters assess site speed issues Google provides several tools, such as ‘Site Performance’ and ‘PageSpeed Insights’. Site Performance was once a feature of Webmaster Labs, today it is no longer available in Google webmaster tools. The tool was designed to show average page load time statistics, over a period of a few months. Today, the new and much improved way to monitor website performance is through the ‘Site Speed’ tool, which is a part of Google analytics.

The Site Speed analytics measure three aspects of latency:
- Page load time for a sample of page views on your website. This allows you to examine how quickly your pages load on average in different browsers and geographic areas. No setup is required and you can see your data in the Overview and Page Timings reports under Content menu.
- With additional setup you can also measure execution speed or load time of any discrete hit, event, or user interaction that you want to track. For example this includes measuring how quickly specific images or JavaScript libraries load on your website. It requires adding JavaScript to your pages that pass user timings information to Google Analytics. (https://developers.google.com/analytics/devguides/collection/analyticsjs/user-timings)
- Parsing time of the document, which measures how long it takes for a browser to construct a page and make it available to the users for interaction. No setup is requires and you can access these data from “DOM Timings” sub tab under “Page Timings”.
Another extremely useful tool, which helps webmasters in troubleshooting speed issues, is Google PageSpeed Insights. There are a couple of ways to analyze pages with page speed. For example Google Analytics provides “Speed Suggestions” that can be accessed from the “Site Speed” menu, or by installing browser plugins. At iwebchk.com, page speed is an important part of the overall website review and we utilize Google’s PageSpeed API to generate recommendations.
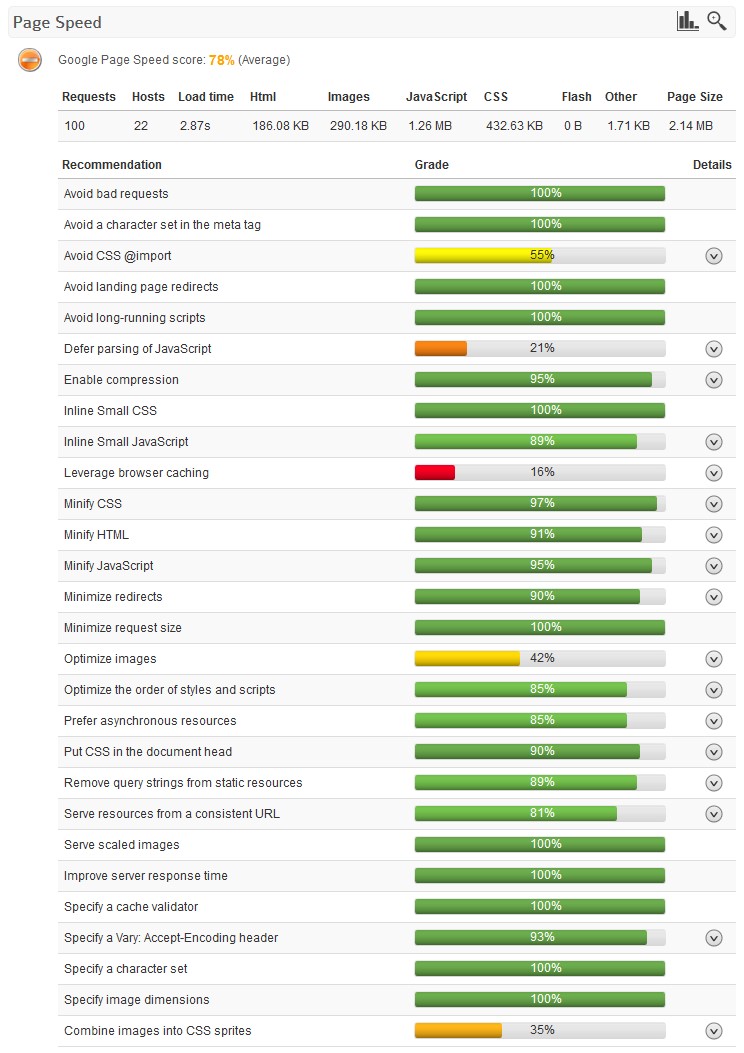
Our page speed test provides following information:
- Requests – number of requests per page. Each resource on the webpage such as image, CSS file or JavaScript library has to be requested from a web server. Therefore each webpage takes multiple server requests to build. Since each request takes time to execute and load it is recommended to keep the number of requests as low as possible.
- Hosts – is number of hosts from which webpage resources are obtained. This number basically indicates from how many different domains and subdomains the page elements such us HTML code, javascript files, images etc. are downloaded from. The optimal number of hosts depends on the number of requests.
- Load time –is the time in seconds that took for the webpage to load.
- Html – is the size in bytes of the webpages HTML code.
- Images – is the total size in bytes of all images on the webpage.
- JavaScript – is the total size in bytes of all JavaScript files loaded with the webpage.
- CSS – is the total size in bytes of all style sheet files loaded with the webpage.
- Flash – is the total size in bytes of all flash downloaded.
- Other – is the total size in bytes of other resources loaded such us fonts, sound files etc.
- Page Size – is the total web page size in bytes. It is recommended to keep the size of the web page as low as possible which will minimize load time.
Additionally Page Speed provides 28 scores with recommendations for improvements:
- Avoid bad requests
- Avoid a character set in the meta
- Avoid CSS @import
- Avoid landing page redirects
- Avoid long-running scripts
- Defer parsing of JavaScript
- Enable compression
- Inline Small CSS
- Inline Small JavaScript
- Leverage browser caching
- Minify CSS
- Minify HTML
- Minify JavaScript
- Minimize redirects
- Minimize request size
- Optimize images
- Optimize the order of styles and scripts
- Prefer asynchronous resources
- Put CSS in the document head
- Remove query strings from static resources
- Serve resources from a consistent URL
- Serve scaled images
- Improve server response time
- Specify a cache validator
- Specify a Vary: Accept-Encoding header
- Specify a character set
- Specify image dimensions
- Combine images into CSS sprites
Finally, it is worth noting that hardware and bandwidth play an important part in the speed of a website. We have seen numerous times, website scoring low on many of Google’s PageSpeed recommendations yet achieving a high overall score with extremely fast load times.
Having said that, we have seen great speed improvements by implementing these recommendations, so if the website you are reviewing is slow, first invest resources in optimization. If you are confident that you have done everything you can in terms of webpage and server optimization and the score still is low, it might be time to look for another web hosting provider.


